Learning Analytics
Overview
Artemis integrates different statistics for students to compare themselves to the course average. It allows instructors to evaluate the average student performance based on exercises and competencies.
To preserve the individual's data privacy, Artemis calculates the data on the fly and only shows aggregated data to instructors so that it's not possible to track an individual student within the learning analytics modules.
Learning Analytics for Instructors
Artemis provides instructors with several different learning analytics, which are detailed in this section. Key statistics such as the number of total assessments or the average student score are already displayed on the course's main page.

Course Statistics
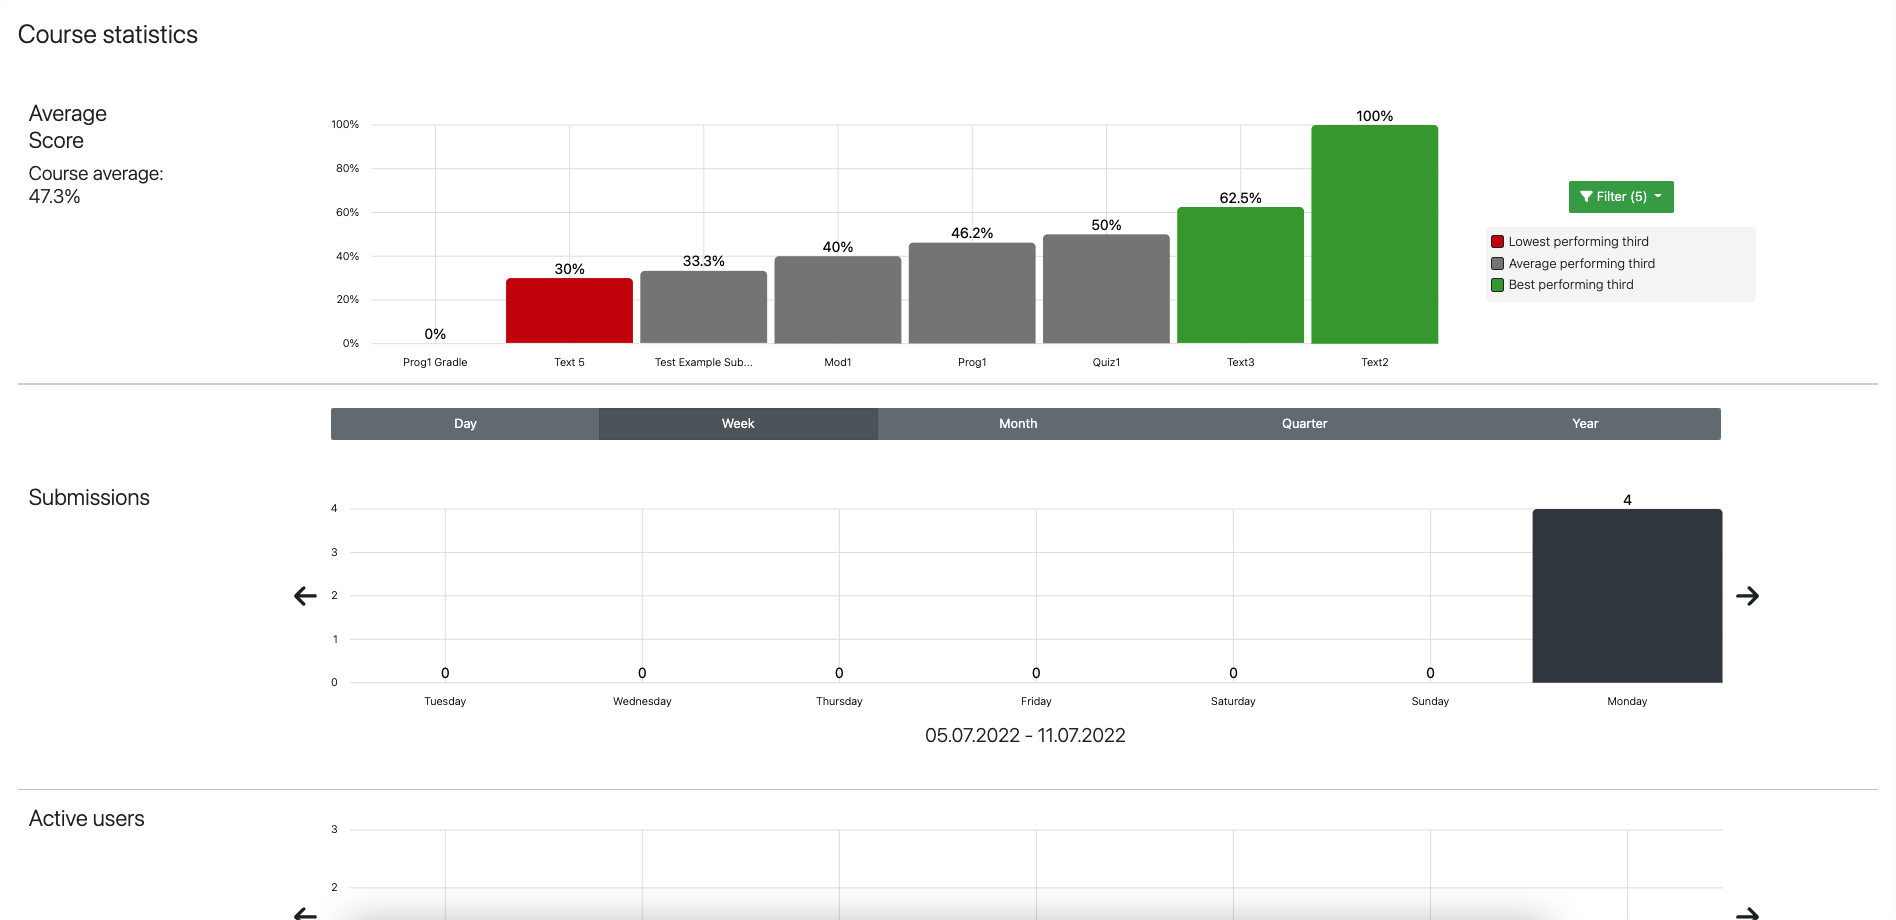
More detailed as well as additional course statistics can be inspected by instructors when navigating to the course's Statistics page.

On this page instructors can explore and evaluate all available course statistics such as the average points, number of submissions, number of active users, and much more. All the statistics can be generated for different time frames.
Exercise Statistics
Similar to course statistics instructors can have an overview of different learning metrics such as the average score or the participation rate for a specific exercise.
To get to this view, instructors can either click on one of the average score bars of the Course Statistics or click on the Statistics button that is displayed on each exercise overview page.

See Also
For information regarding how learning analytics tie into competencies in Artemis, please refer to the Adaptive Learning documentation.